
The Complete Content Databases Tutorial
Learn how to research YouTube markets, track demand, and avoid spending weeks on a niche that has already lost its audience. Content Databases are available on the Pro plan, and this guide will help you decide whether they fit your workflow.

What you will learn
Why databases are useful for YouTube growth
How to build a database in minutes
How auto-search discovery works
How to track market demand in real-time
How to interpret the data in databases
Why databases?
Most creators upload blindly. They:
Enter niches with no demand
Upload content nobody is watching anymore
Waste months before realizing the market is dead
Databases give you a clearer picture. A database:
Automatically tracks a niche’s videos, searches, and channels
Shows you where the real attention is right now
Reveals what topics are breaking out before others know
Helps you act when the market shows real demand
Why you need them
At its simplest, YouTube is a question of supply and demand.
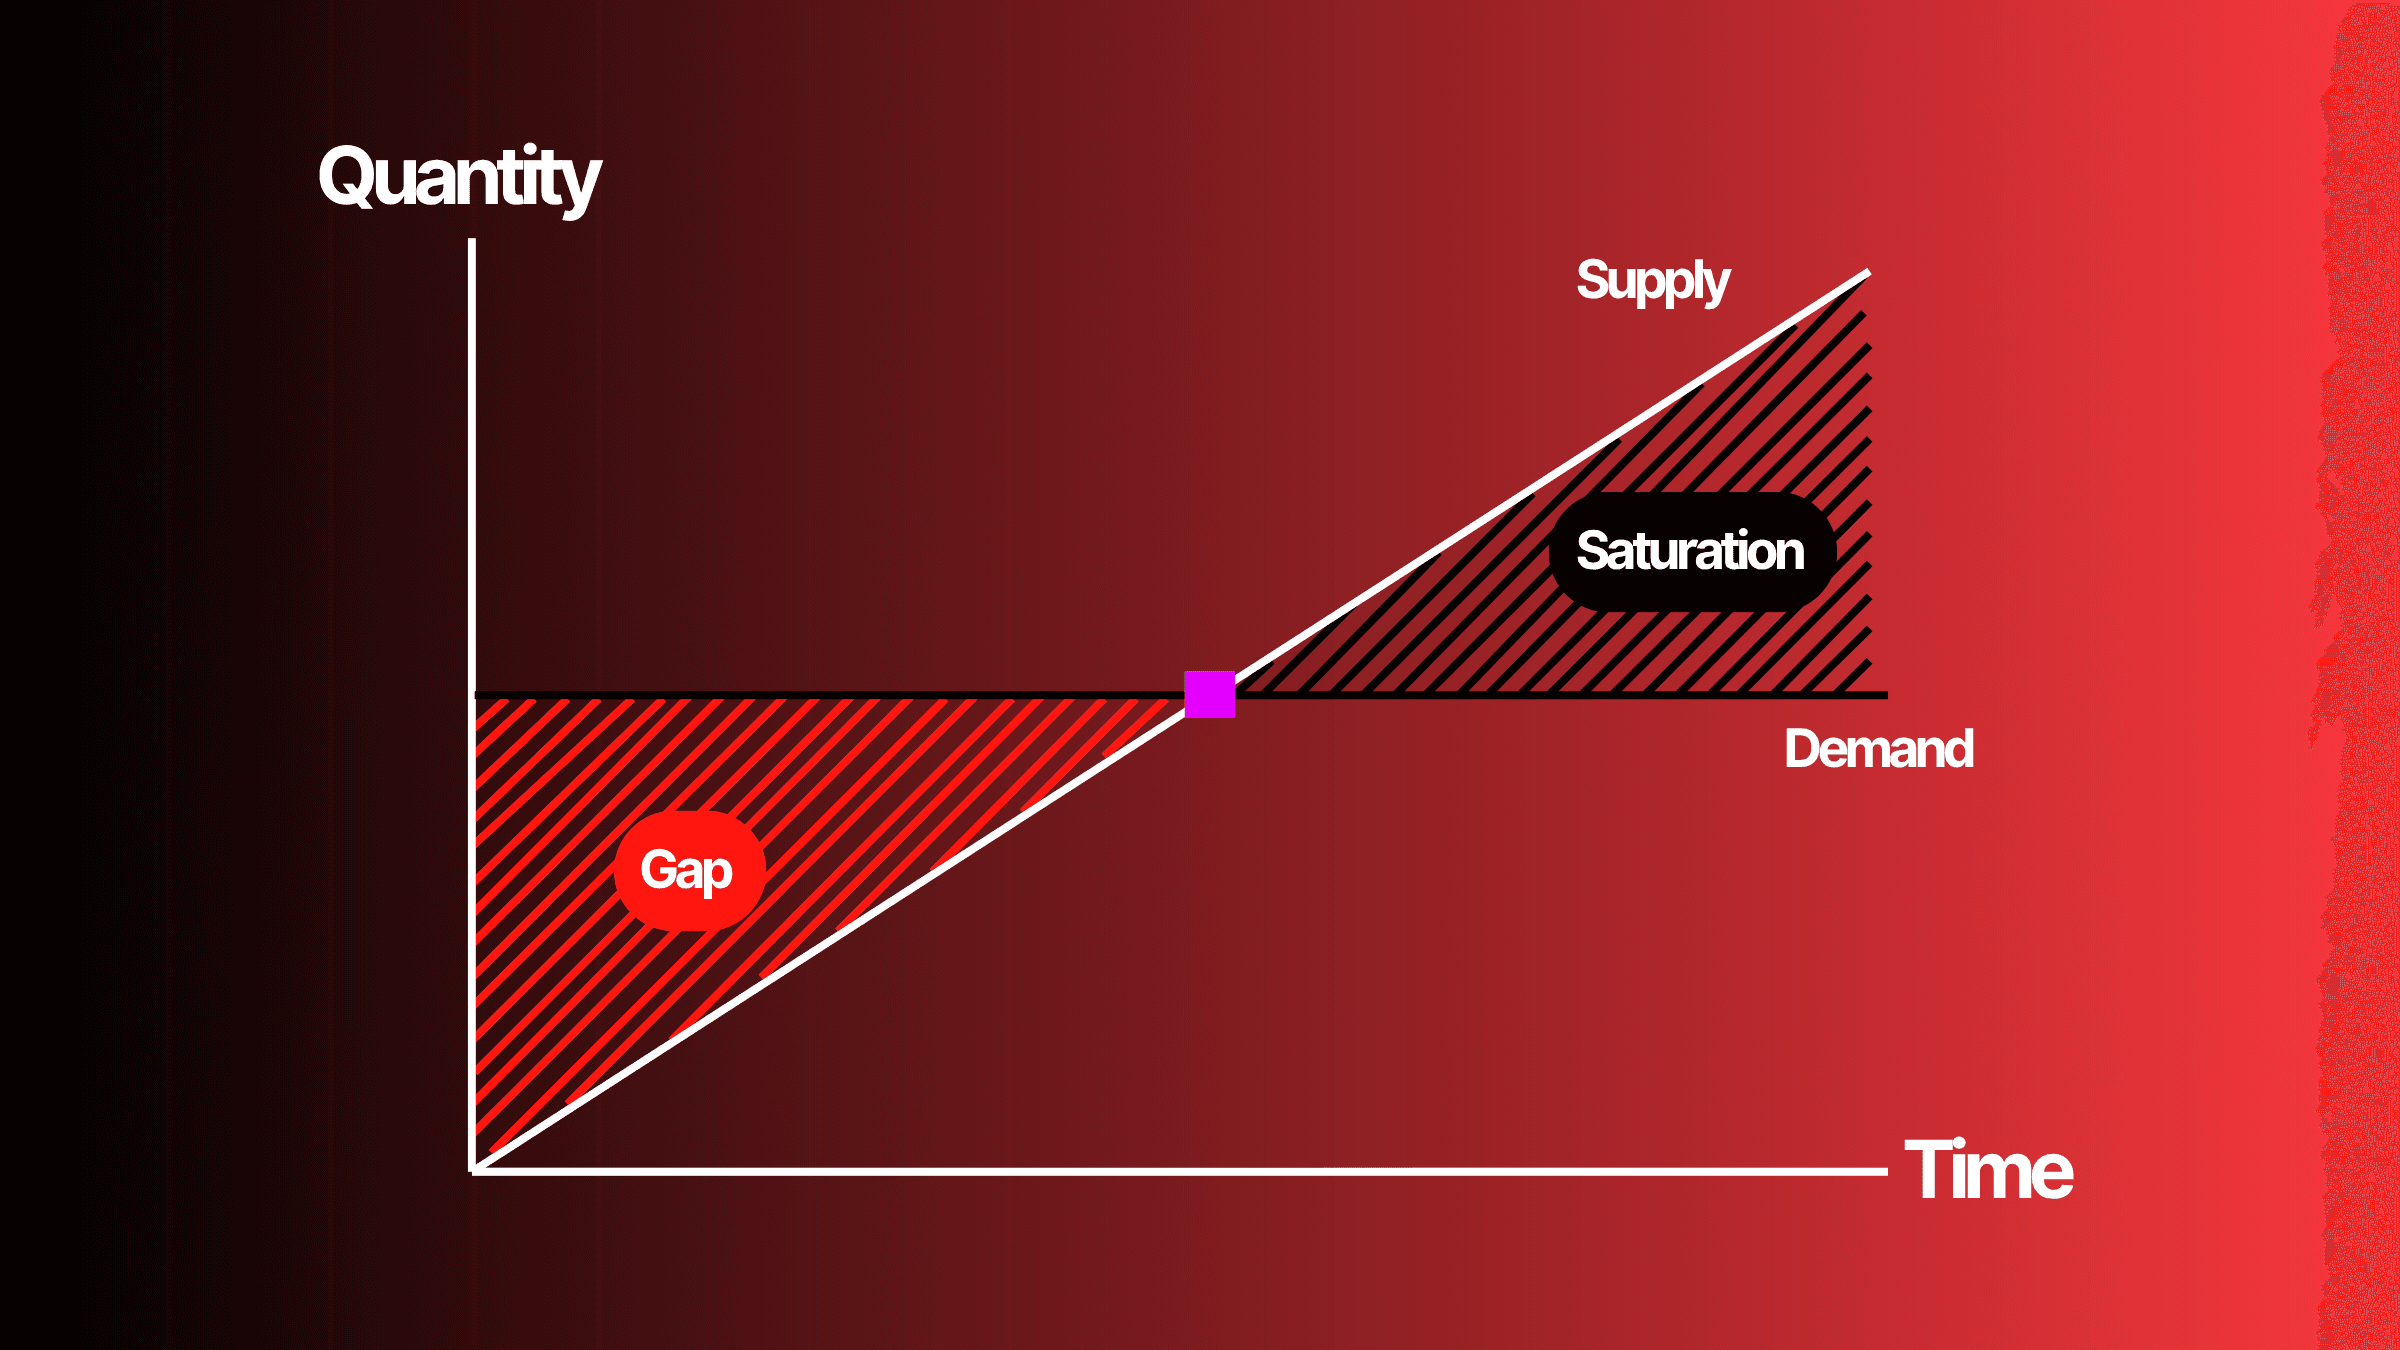
Supply is the number of videos being posted.
Demand is the number of viewers watching.
Without tracking demand:
You publish without evidence that viewers want the topic.
You may blame the algorithm without seeing that the market has moved.
With databases:
You find exploding topics
You see opportunity windows sooner
You only make videos with proven audience demand
How to create a database
Step 1. Name your database
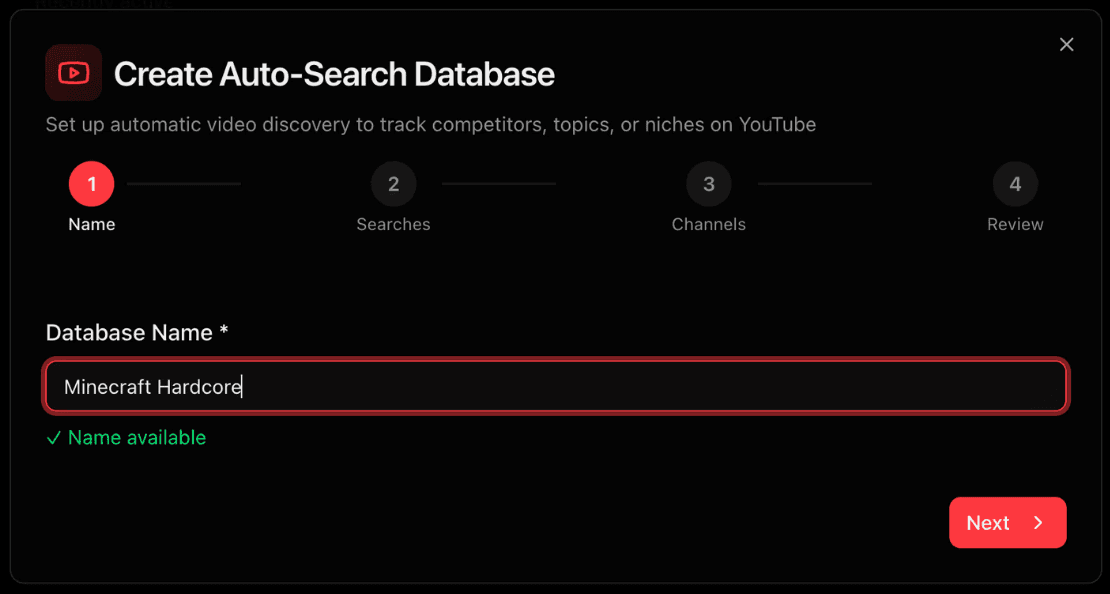
Step 2. Add auto-searches
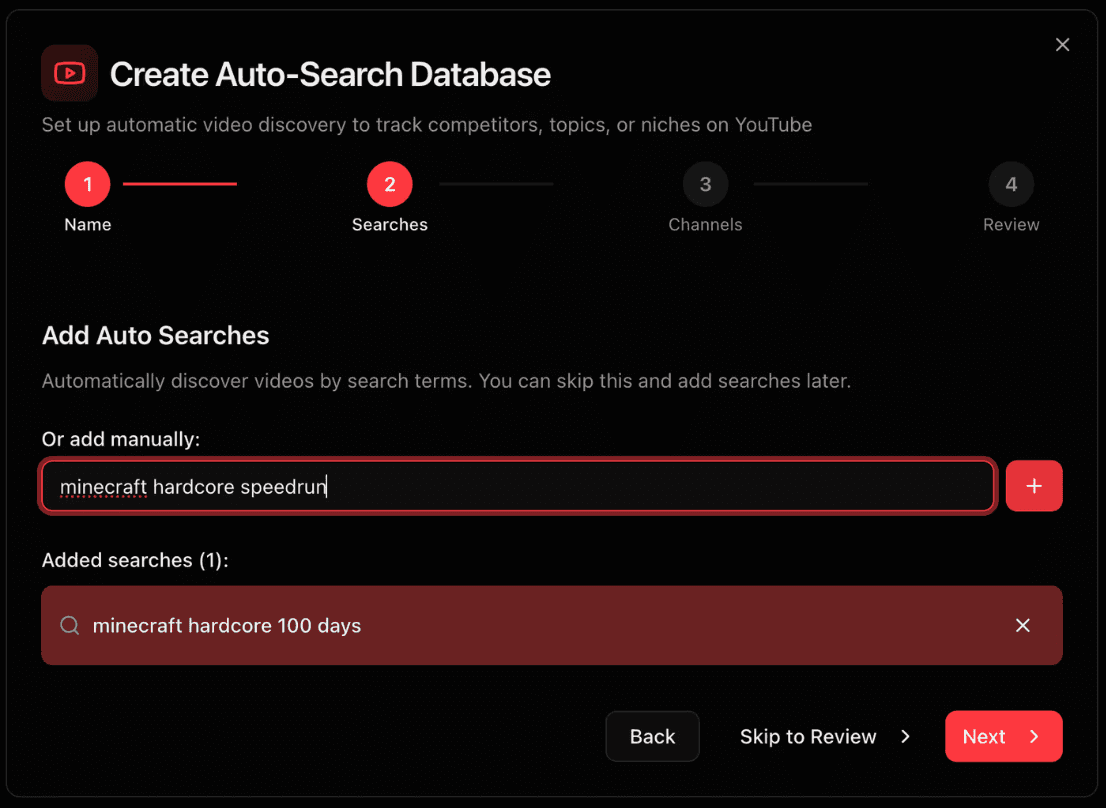
Auto-searches check YouTube for new videos once every 24 hours. They populate your database automatically and help you spot fresh uploads. You can also add them later.
Step 3. Add channels
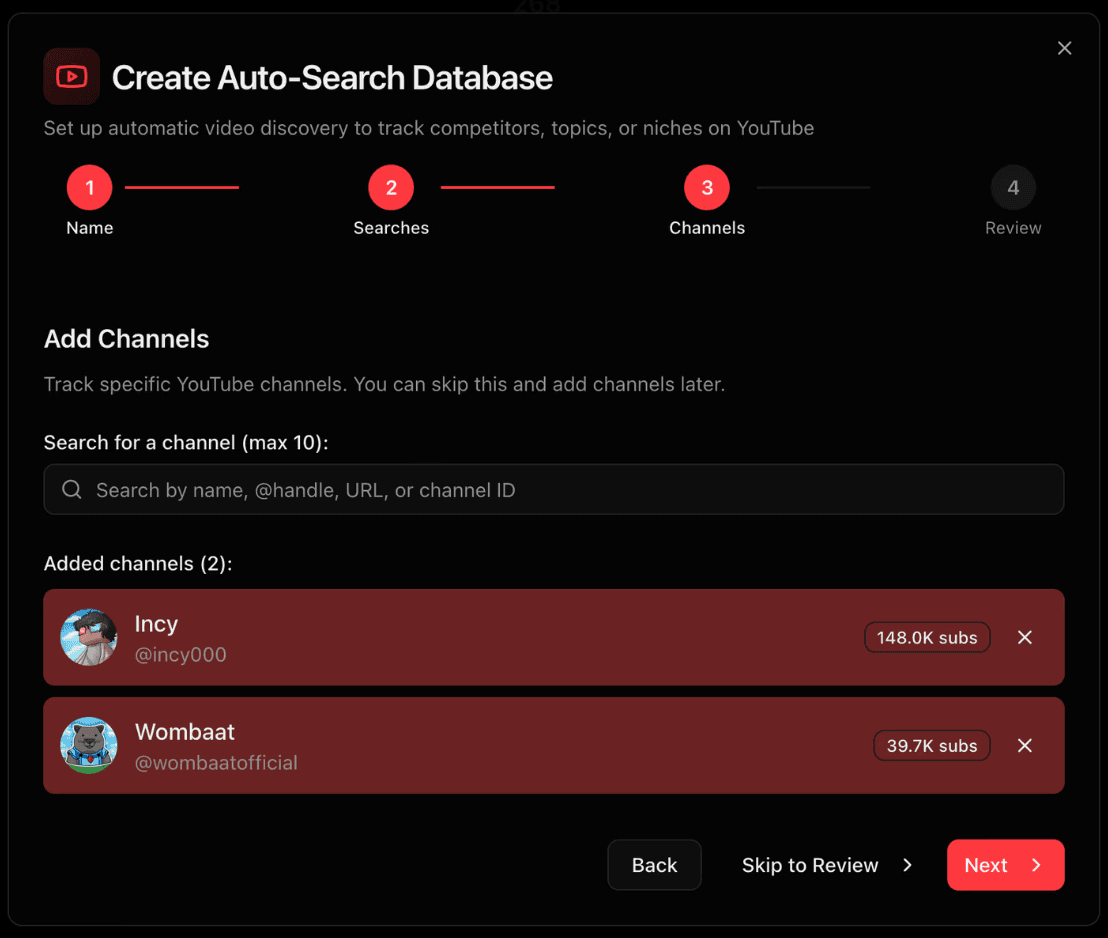
Pick channels that already:
Perform well in the niche/market
Use the format you want to win with
Step 4. Add filters
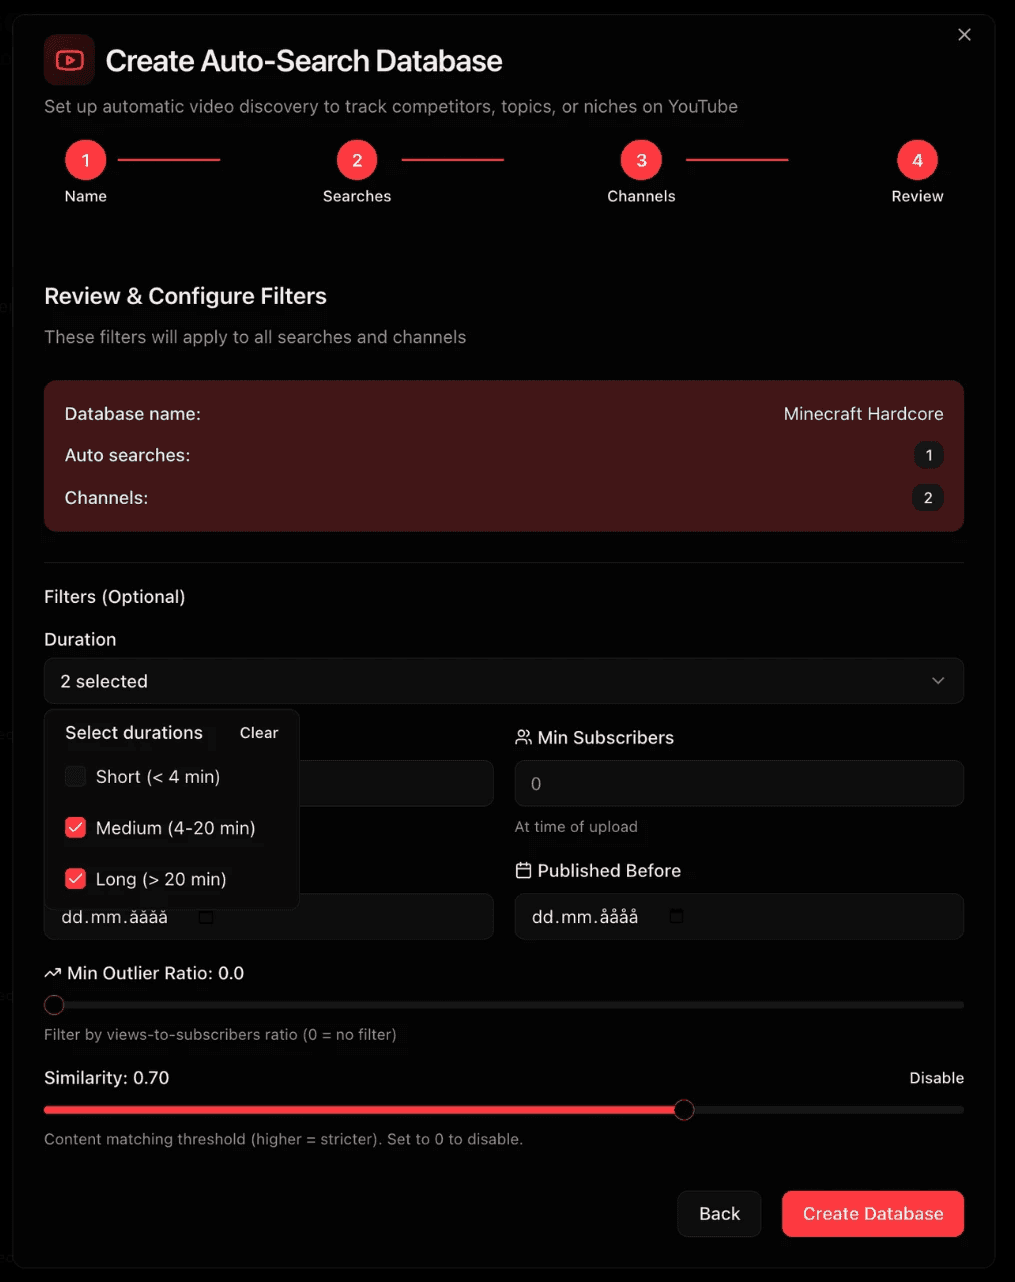
Filters keep the database focused on useful videos:
Video duration (short, medium, or long). Consider filtering out Shorts when their different viewing patterns would make the metrics harder to compare.
Subscriber range. A range such as 500–50,000 subscribers can help you find breakout channels.
Publish timeframe. Recent videos give you a fresher signal.
Outlier ratio. Use this when you want to collect only breakout videos from your market.
Similarity threshold. This controls how closely collected videos must match your search phrase. A high threshold may collect only close matches such as “Minecraft hardcore 100 days,” while a lower threshold may include related videos such as “Minecraft hardcore let’s play.”
For this example, the goal is to collect outliers for one specific search, so the filters are deliberately narrow.
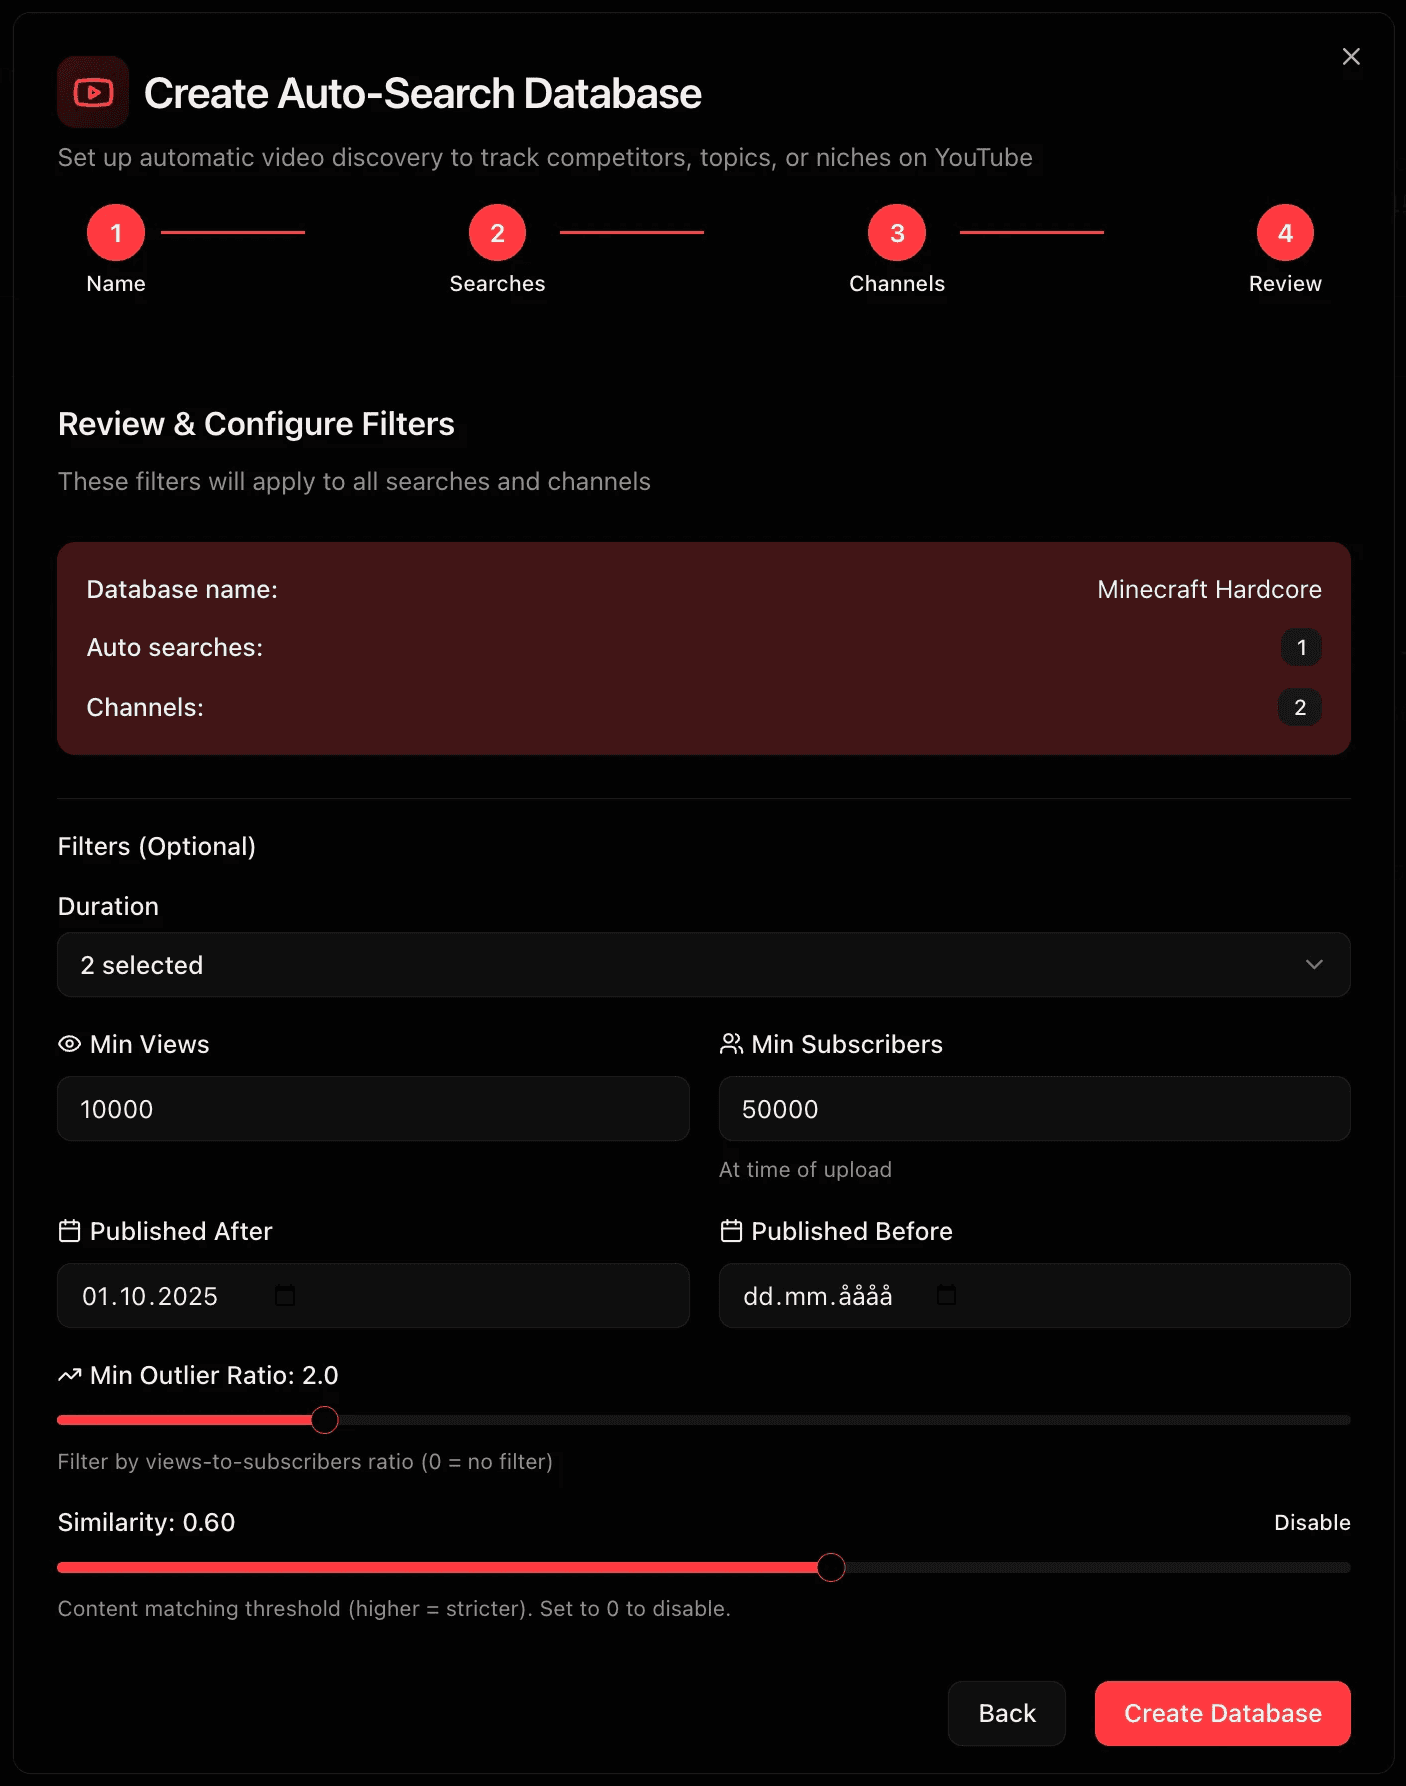
That is the complete setup.
What happens next?
Your database now:
Pulls in relevant videos
Updates every 24 hours
Shows demand rising or falling
Finds outlier topics automatically
Surfaces promising formats
You can now:
See trends before they go mainstream
Validate market size before committing
Fill supply gaps fast
Build a content strategy based on real viewership data
This may feel like a lot at first, so let’s look at each part in detail.
Inside the database
After creation, your database will look something like this. This example contains only a few videos because it was set up to find specific outliers. The auto-searches will begin checking YouTube and adding matching videos. It can take up to 24 hours for a new database to start filling, so give it a day before judging the results. Now let’s look at what is inside.
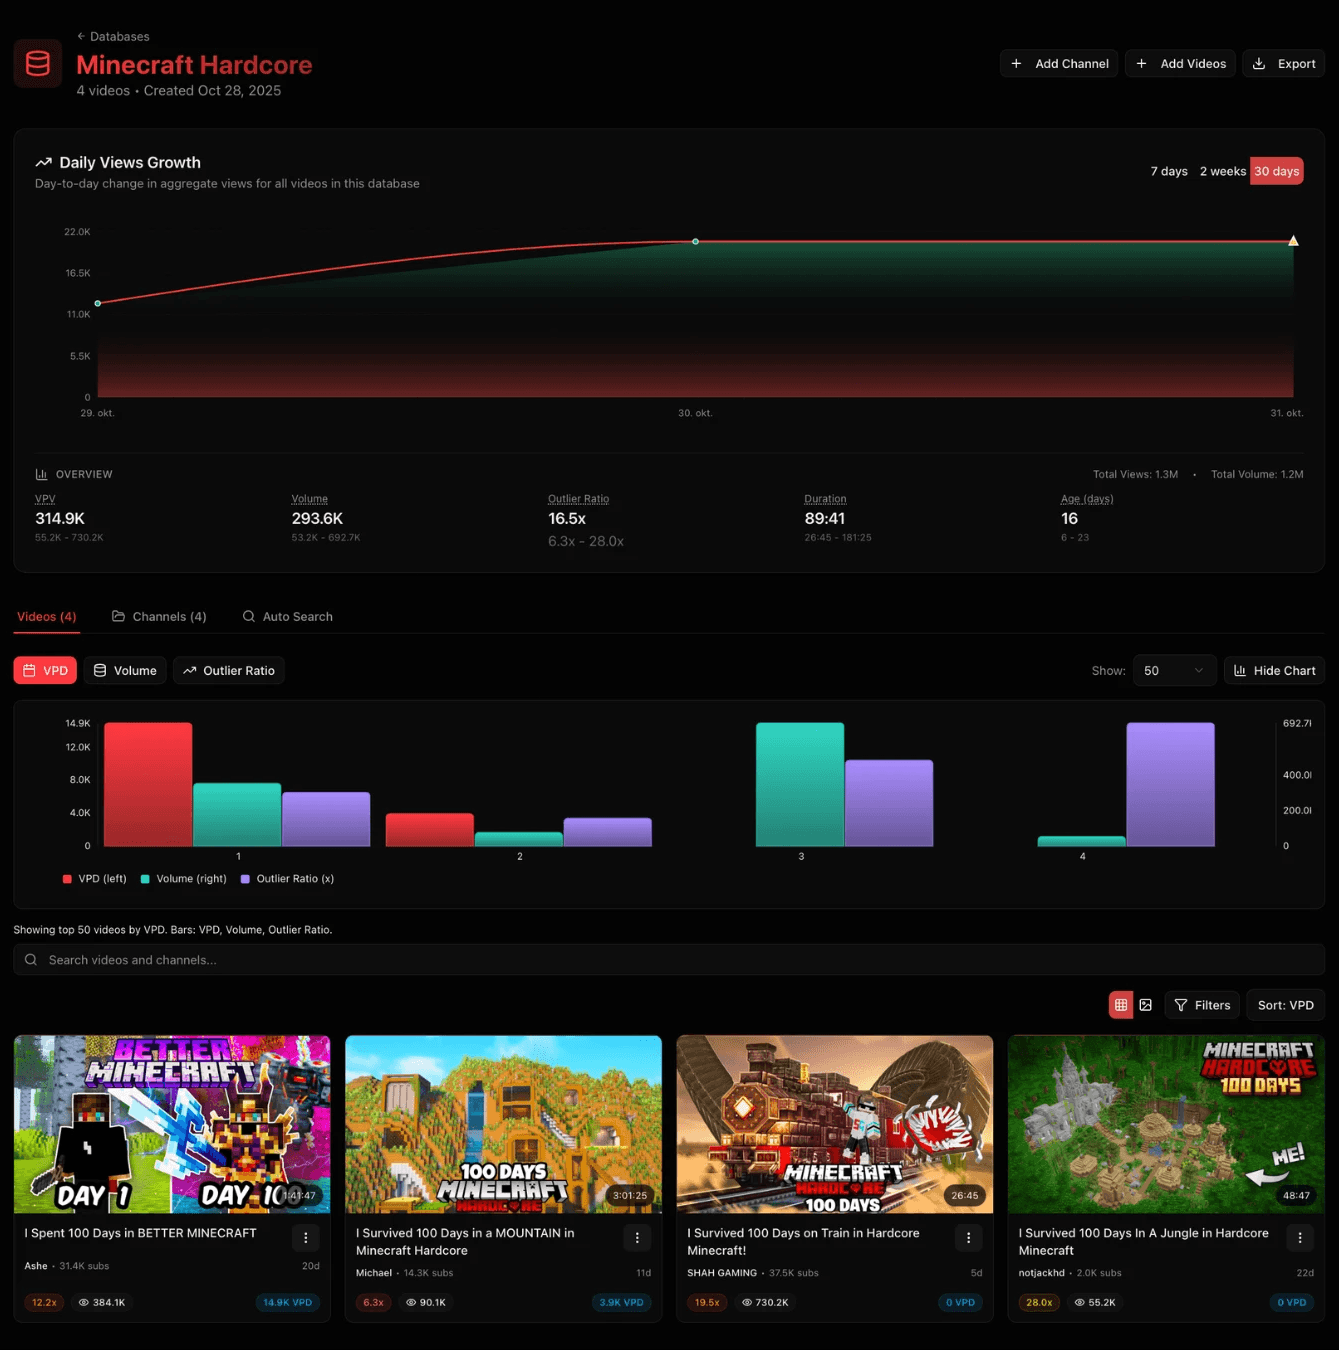
Daily views growth
This chart shows day-by-day growth across the database. A pyramid marker appears when the number of videos in the database changes. Use the chart to see whether total views for a topic or niche are rising or falling.
Other buttons in this section:
Add channel: add another channel whenever you need one.
Add videos: add individual videos to the database.
Export: download the database and its data for analysis elsewhere.
Videos tab
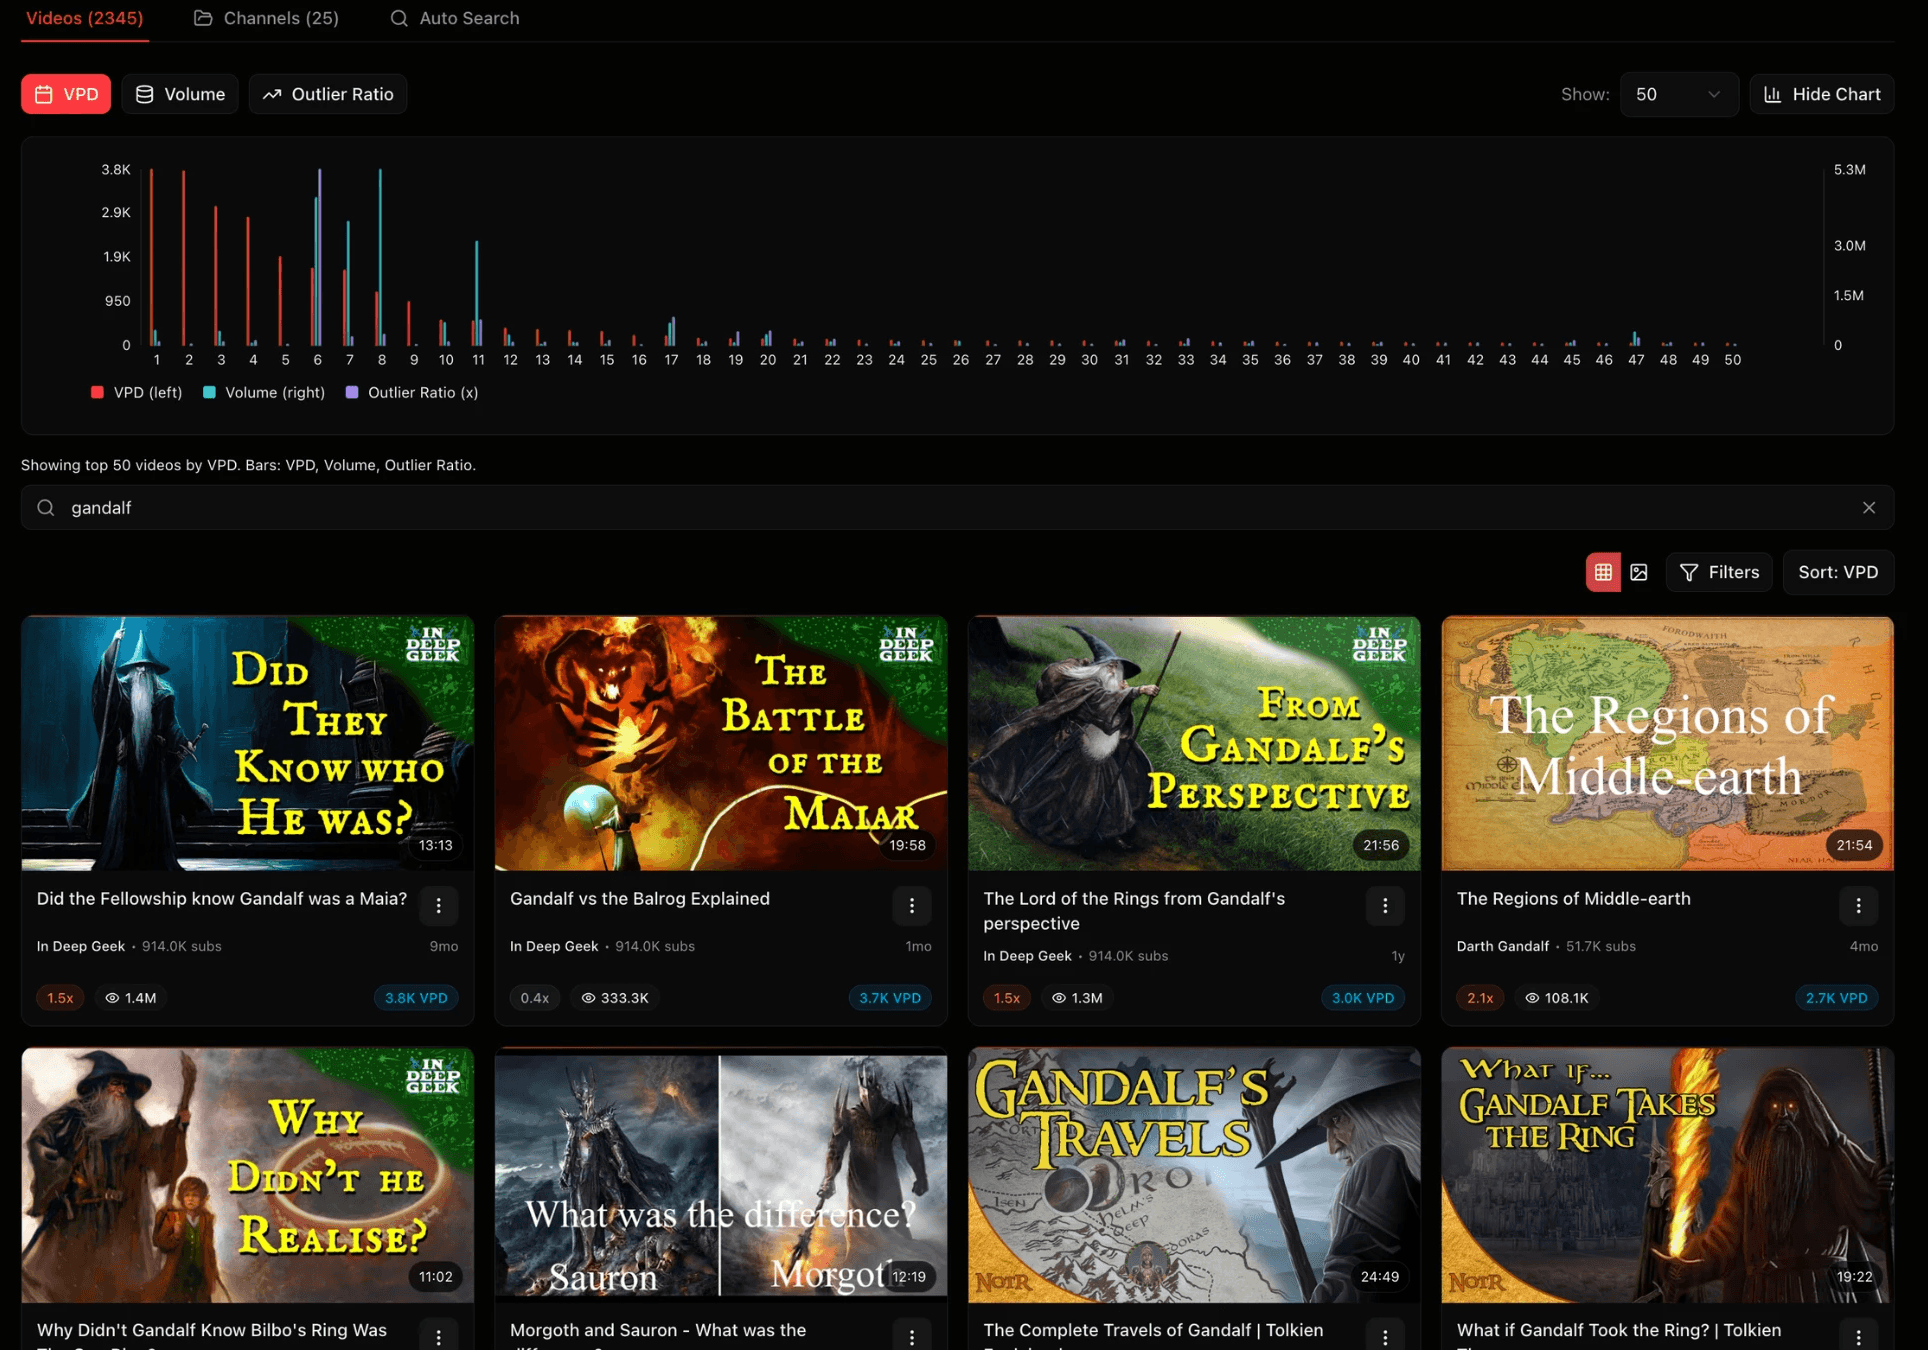
This tab displays every video currently in the database. You can filter by VPD, volume, or outlier ratio and display up to 500 videos at once.
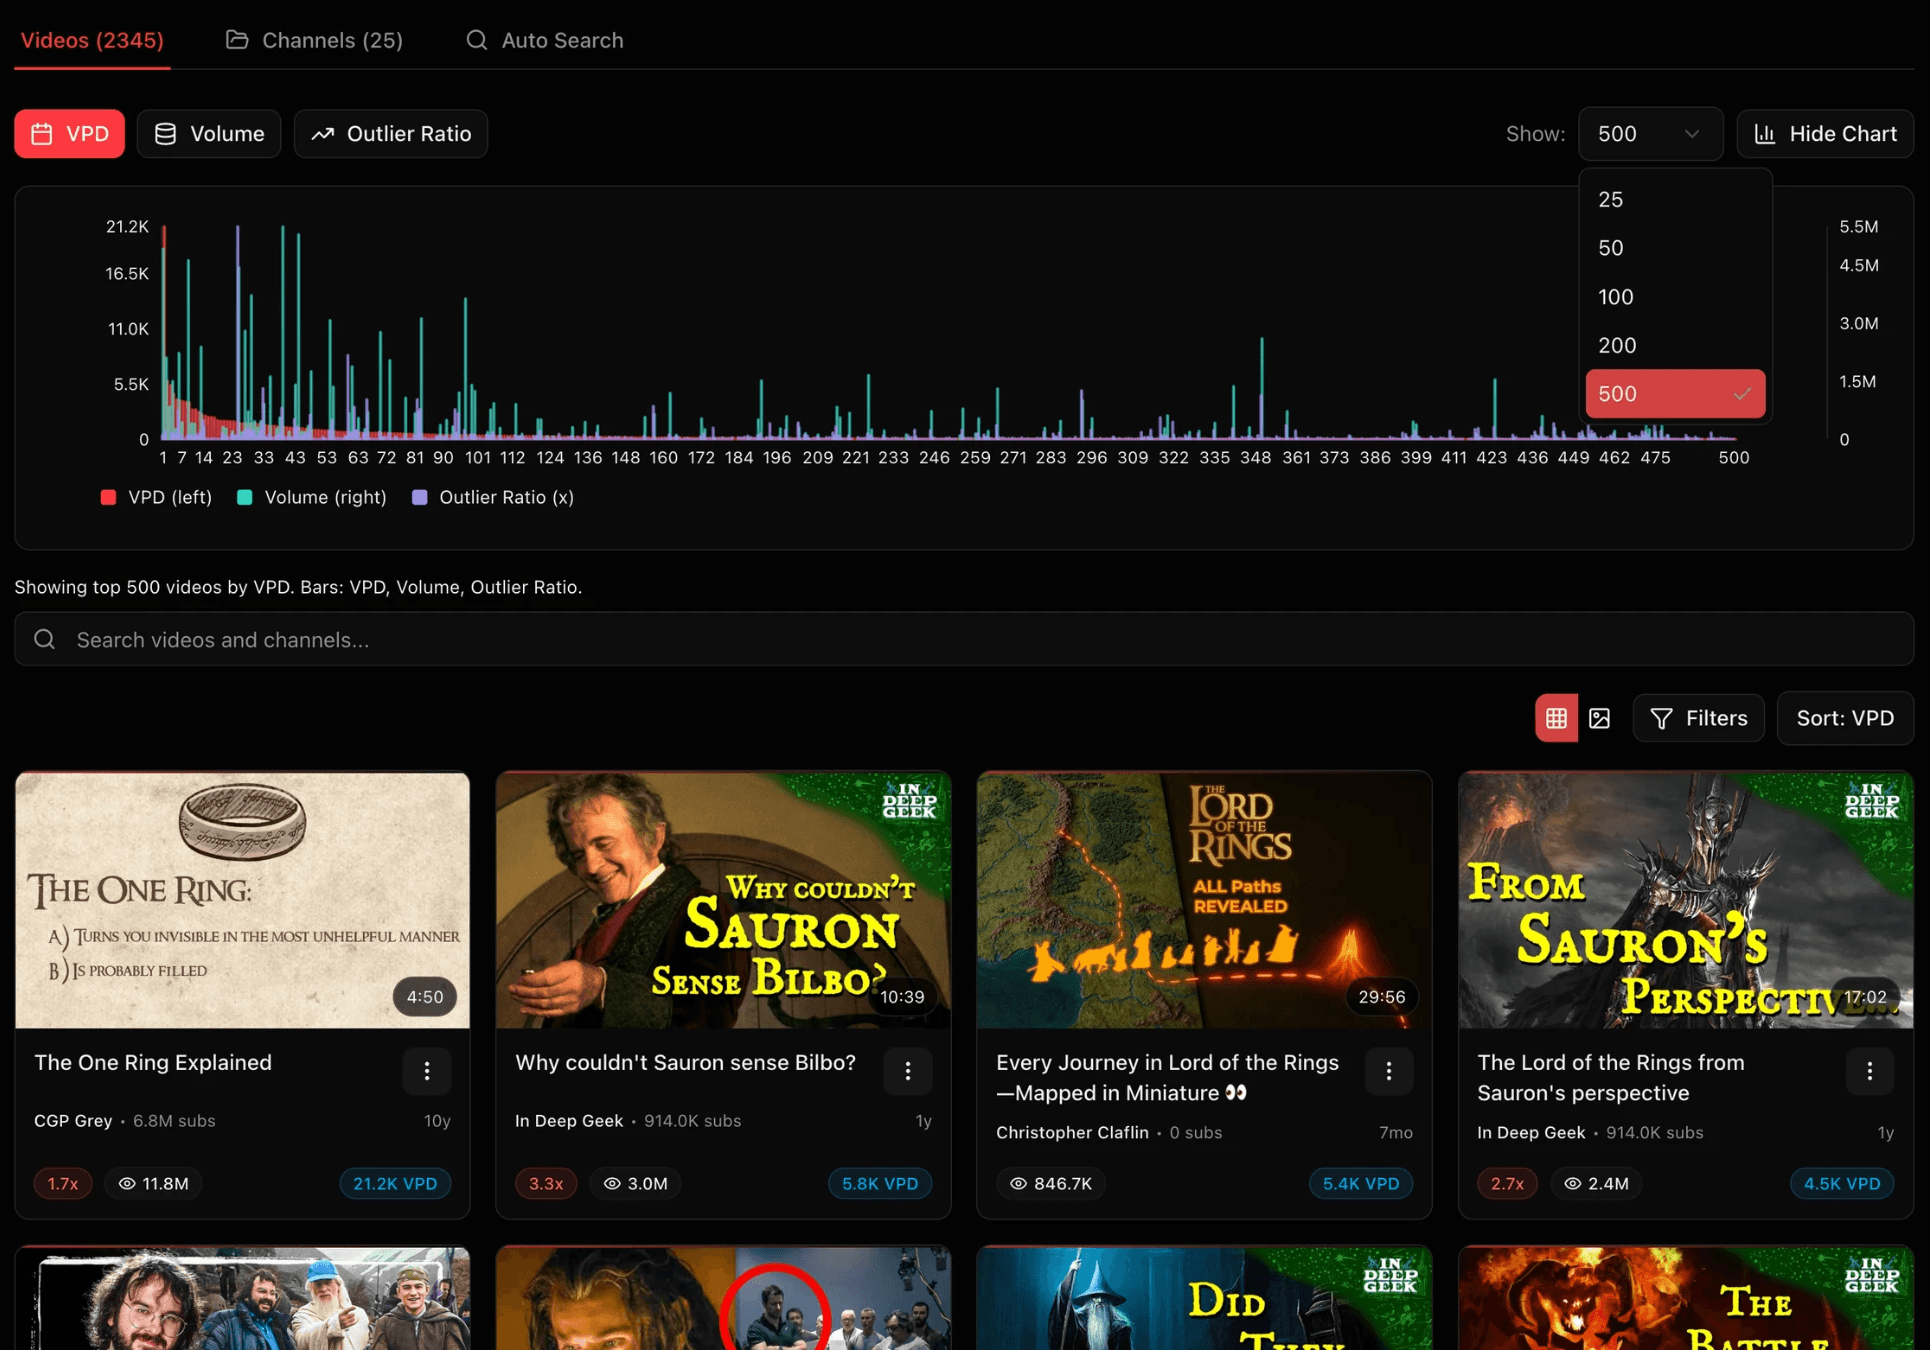
VPD (views per day): measures how many views a video receives each day. It helps you see whether people are still interested in a topic now. Several videos above 10K VPD can be a strong signal, especially when you can bring something new to the market.
Volume (views - subscribers): estimates excess demand. For example, a video with 100K views on a channel with 10K subscribers has a volume of 90K. Higher positive values suggest more demand beyond the existing audience.
Outlier ratio (views / subscribers): compares a video’s reach with the size of its channel. A video with 100K views on a channel with 10K subscribers has a 10x outlier ratio.
Read the metrics together: a 10x outlier ratio means less when a channel has 10 subscribers and the video has 100 views. Mittalmar combines VPD, volume, and outlier ratio to give you a more complete view of demand.
Search bar: search for a specific keyword within the database. For example, you could search for Gandalf inside a Lord of the Rings database.
Channels tab
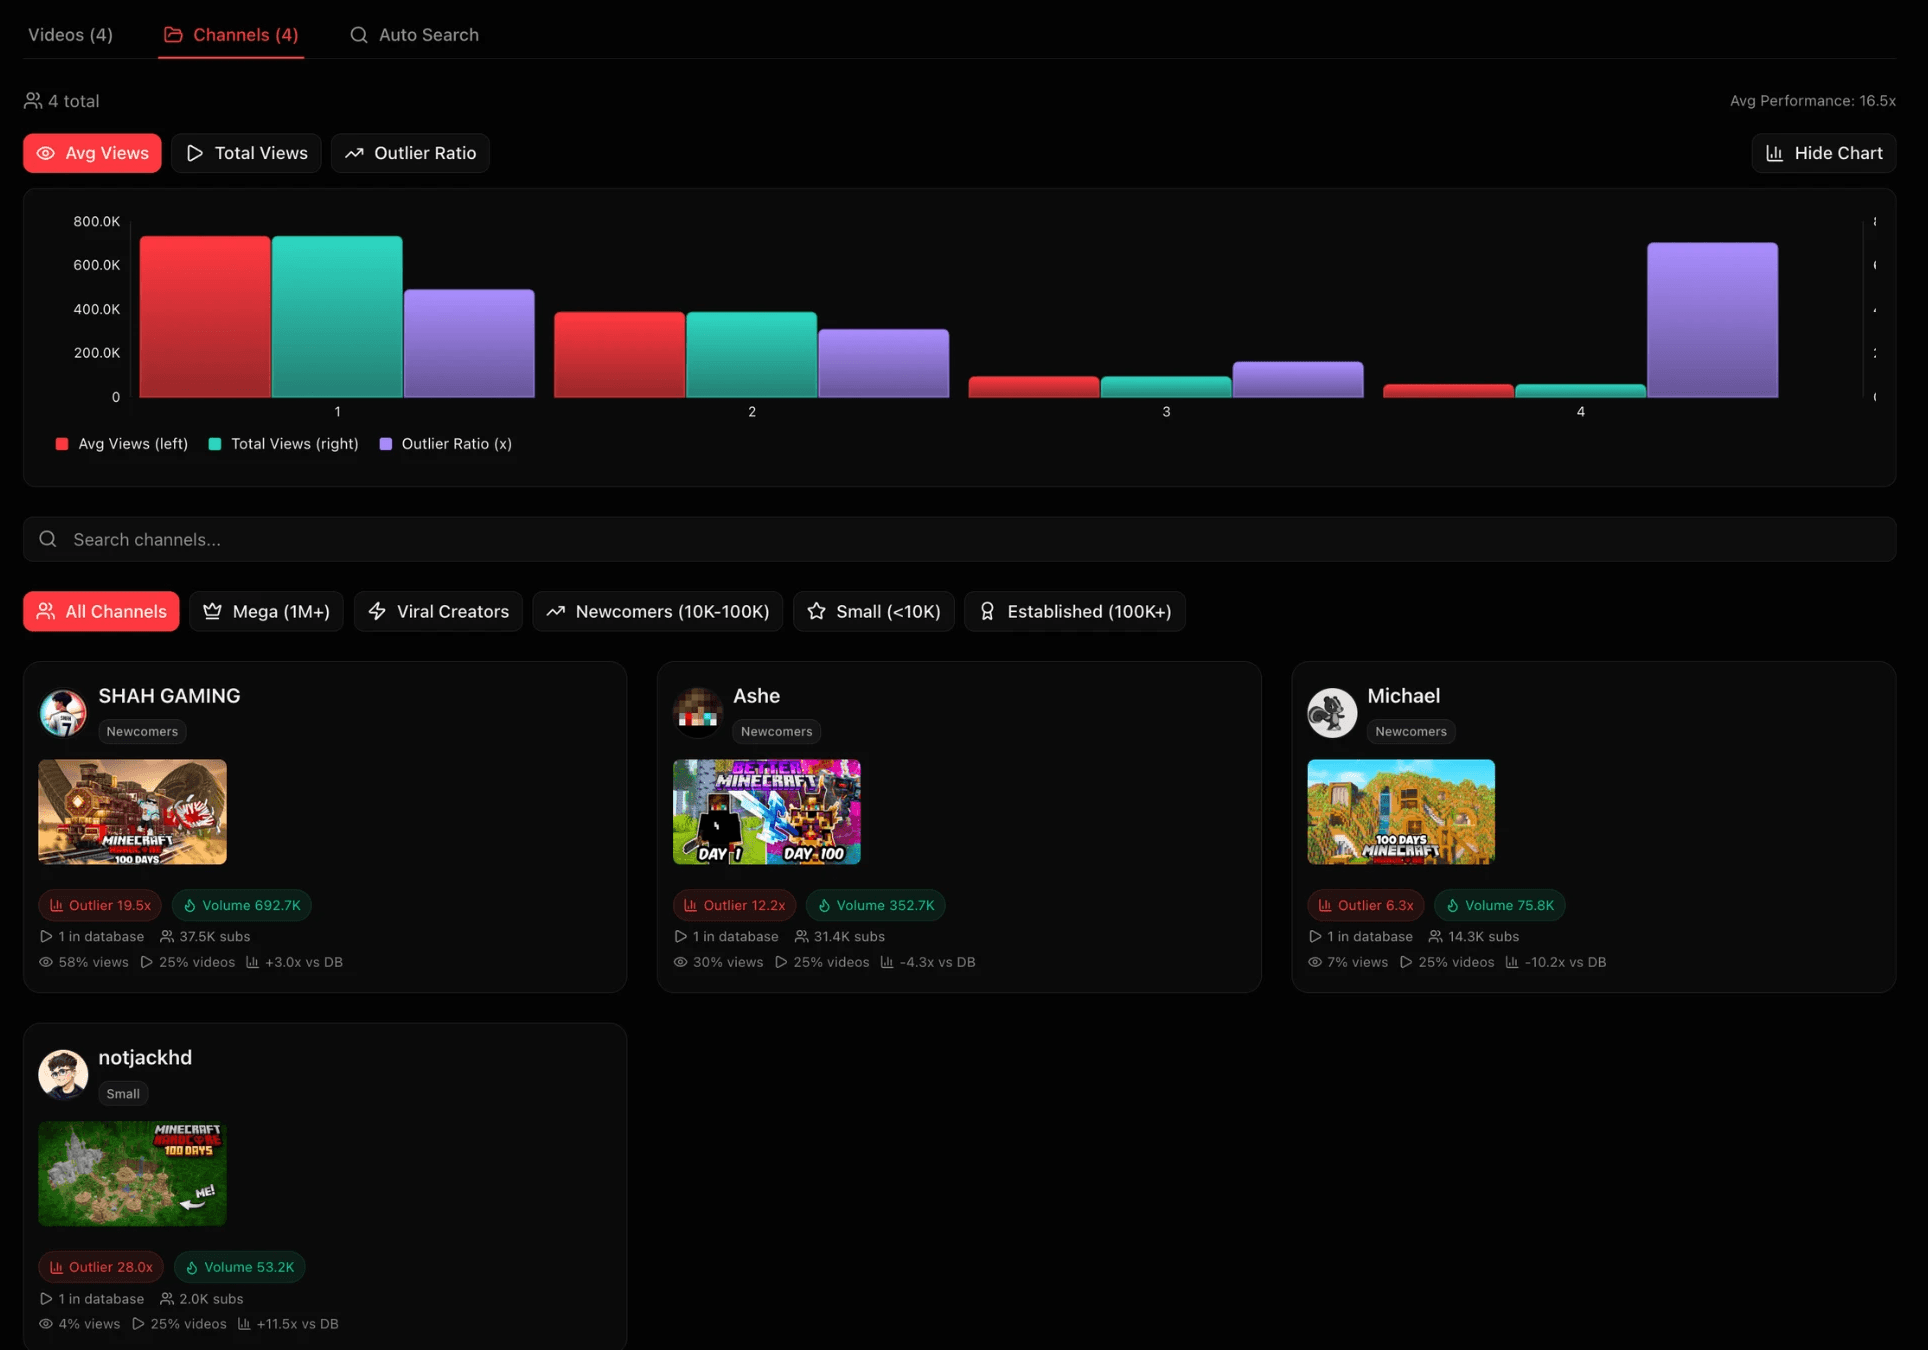
This tab displays every channel in the database. The statistics reflect only the videos included in this database.
Auto-search tab
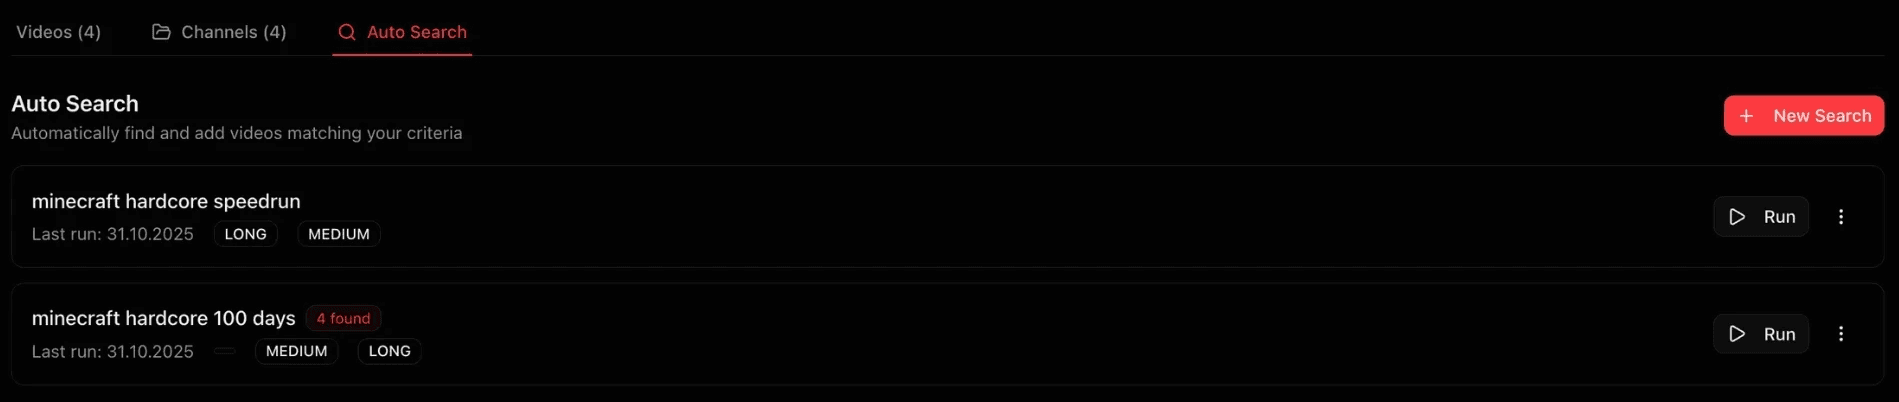
This tab shows every active search collecting data for the database. Searches typically run every 24 hours. You can add, edit, pause, or delete them. More searches can broaden your coverage, but too many can clutter the data, so add them with a clear purpose.
How to interpret and use the data in a content database
There are several ways to interpret the data provided in a database. Here's how to use databases strategically:
Market research: validate attention before committing.
Trend response: act on early momentum around proven topics.
Niche evaluation: separate long-term opportunities from short-term ones.
Competitor tracking: watch what drives other channels’ outliers.
Idea validation: confirm audience demand before production.
Here's how it's done:
1. Identify outliers
Look for videos that significantly outperform their channel size. These reveal excess demand, one of the clearest signs of a breakout topic. Useful signals include:
High Outlier Ratio (2x+)
High VPD (5K-10K minimum)
Fresh upload (<30 days)
If multiple creators produce outliers on the same topic, you have much stronger evidence that the trend is real.
2. Track current demand with VPD
Outlier ratio shows potential, while VPD shows current attention.
5K–10K+ VPD across multiple videos can signal an active market.
Declining VPD can signal fading interest.
Use VPD to judge whether the opportunity window is still open.
3. Monitor daily views growth
Watch the total daily views for the database.
Rising views suggest growing attention.
Falling views suggest cooling demand.
Use this direction to decide when to enter or leave a niche, or when to increase or reduce uploads.
4. Combine metrics for context
Every metric has limits. Read together, outlier ratio, volume, and VPD give you a fuller picture. Positive volume, a high outlier ratio, and sustained VPD across several videos form a stronger signal than any one number alone.
5. Check smaller channels
If creators with fewer than 50K subscribers are breaking out, the demand may be more accessible. If only large channels perform, the niche may be saturated.
6. Search within the database
Use the search bar to focus on subtopics or formats such as “speedrun” or “100 days.” This can reveal smaller trends inside a broad niche.
7. Keep it current
Markets shift daily. Add relevant searches and channels, and adjust filters as the niche evolves. A useful database needs fresh inputs.
One metric rarely gives you a strong signal on its own. The real value comes from reading several signals together.